Process Window Analysis: How to Find Your Sweet Spot
In semiconductor manufacturing, every process step has a “safe zone” — a range within which product quality meets specifications and yield remains stable and controllable. This range is the Process Window. Finding it, understanding it, and maintaining it is the core mission of every process engineer. However, as technology nodes continue to shrink, process windows become increasingly narrow, and traditional manual exploration methods are no longer sufficient. This article explores how AI-driven methods can efficiently locate the process window’s “sweet spot.”
1. What Is a Process Window, and Why Does It Matter
A process window is the range of parameter combinations in multi-dimensional parameter space that simultaneously cause all critical quality metrics (such as film thickness, CD, etch depth, uniformity, etc.) to meet specifications. In simple terms, it is the “safe zone” for process parameters.
The size of the process window directly determines three things:
- Yield stability: The wider the window, the less parameter drift impacts yield, and the more stable production becomes.
- Equipment tolerance: A wide window means that minor deviations in equipment precision do not immediately trigger quality issues.
- Mass production feasibility: If the process window is too narrow, even a process validated in the lab may frequently trigger OOC (Out of Control) alarms during volume production.
Take lithography as an example: in the two-dimensional space formed by exposure dose and depth of focus, the region where CD (Critical Dimension) meets specifications is the classic Bossung curve process window. At advanced nodes, this window may have only a few nanometers of margin — the slightest deviation can cause yield collapse.
2. Traditional Methods: The Limitations of Manual Parameter Sweeps
Traditional process window analysis methods can be summarized as OFAT (One Factor At A Time) or simple full factorial experiments:
- Select target parameters: e.g., temperature, pressure, gas flow.
- Sweep one at a time: Hold all other parameters fixed, vary one parameter, run wafers, and measure.
- Plot trend charts: Identify the acceptable range for each parameter.
- Take the intersection: The intersection of all parameter-acceptable ranges is the process window.
The problems with this approach are obvious:
- Ignores interaction effects: Parameters are often coupled. The optimal combination of temperature and pressure is not simply the superposition of their individual optima.
- High test wafer cost: Five parameters at five levels each requires 55 = 3,125 runs in a full factorial experiment — no fab can afford that.
- Low efficiency: Engineers may spend weeks roughly defining the window, during which equipment conditions may have already drifted.
- Static results: Traditional methods produce a snapshot of the process window at a single point in time, unable to reflect changes caused by equipment aging.
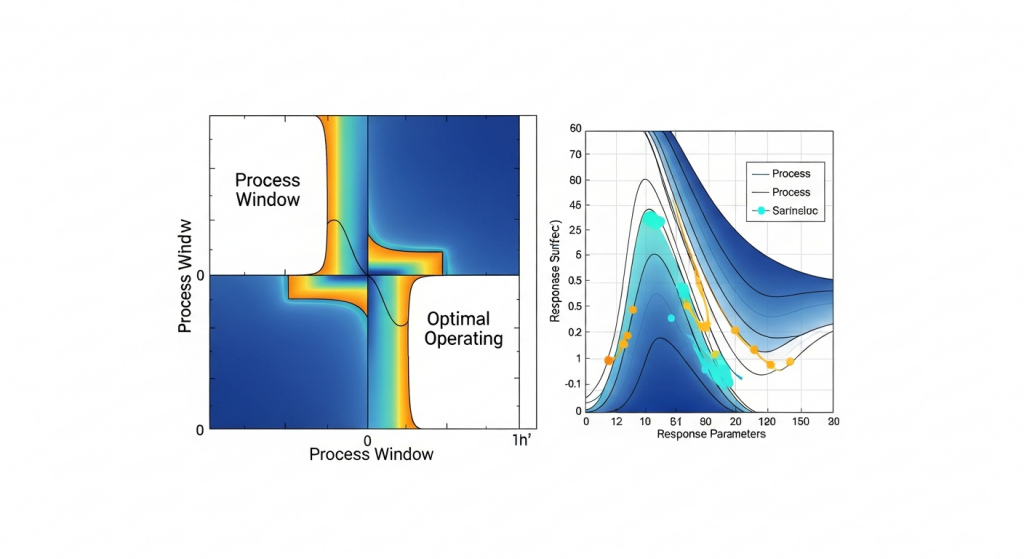
3. AI Methods: Response Surface + Cpk Contour Maps
AI-driven process window analysis fundamentally changes the paradigm. The core approach is to build a parameter-to-quality response surface model using a small set of experimental data, then efficiently search for the optimal window within the model space.
3.1 Response Surface Modeling
Using DOE (Design of Experiments), a small number of key data points are collected (typically only 10-20% of the test wafers required by full factorial experiments). Gaussian Process Regression or deep learning models are then used to construct a continuous mapping from parameters to quality metrics. The model provides not only predicted values but also prediction uncertainty — which is critical for defining window boundaries.
3.2 Cpk Contour Map Method
Traditional methods only check “whether a parameter is within specification,” whereas the Cpk contour map method goes further: at every point in the parameter space, it calculates the corresponding process capability index Cpk. Cpk considers not only whether the mean is centered within specifications but also the magnitude of process variation.
Plotting Cpk values as contour maps provides an intuitive visualization:
- Cpk > 1.67 region: The sweet spot — ample process capability for confident production.
- Cpk between 1.33 and 1.67: Acceptable zone — usable but with limited margin.
- Cpk < 1.33 region: Risk zone — the slightest fluctuation may cause out-of-spec results.
This provides far richer information than a simple “pass/fail” binary classification.
4. Process Window Visualization: Green/Yellow/Red Zones
Effective visualization is key to making process window analysis actionable. MST Semiconductor recommends a three-color zoning approach for intuitive representation:
- Green Zone (Safe Zone): Cpk >= 1.67, all quality metrics have ample margin. This is the recommended production parameter region. Engineers should aim their equipment setpoints at the center of the green zone.
- Yellow Zone (Warning Zone): 1.0 <= Cpk < 1.67, quality metrics meet specifications but with limited margin. Acceptable for short-term use, but close monitoring and parameter correction should be considered.
- Red Zone (Danger Zone): Cpk < 1.0, insufficient process capability with high yield risk. Not permitted for production parameters.
For multi-dimensional parameter spaces (which in practice often involve 5-10 parameters), dimensionality reduction projections or fixed non-critical parameter slicing can generate pairwise parameter views, helping engineers understand the window width across each parameter dimension.
5. Strategies for Narrow Process Windows
As technology nodes shrink, more process steps face the challenge of “narrow windows” or even “nearly zero windows.” This requires systematic countermeasures:
5.1 Improve Equipment Precision
If the process window is so narrow that the equipment’s own control precision is insufficient, the first step is hardware upgrades: higher-precision MFCs (Mass Flow Controllers), temperature control modules, etc. However, this often involves significant capital investment.
5.2 Introduce Real-Time Compensation (R2R Control)
Through Run-to-Run control, the parameter setpoints for the next batch are dynamically adjusted based on the measurement results of the previous batch, keeping the actual operating point locked at the center of the window. This effectively compensates for a narrow window width with control precision.
5.3 Process Window Centering Strategy
AI models can help identify the optimal setpoint at the window center that simultaneously maximizes Cpk for all quality metrics. This is a multi-objective optimization problem that is difficult to solve with traditional methods but can be handled efficiently by AI algorithms (such as Pareto optimization).
5.4 Dynamic Window Updates
Equipment conditions change over time (consumable wear, chamber contamination, etc.), and the process window is not static. AI systems can combine real-time sensor data to continuously update the process window model and issue warnings before the window contracts.
6. From Analysis to Implementation
Process window analysis should not be a one-time research exercise but should be integrated into the closed loop of daily production management:
- Initial Window Establishment: During new process development, use Smart DOE to quickly build an initial process window model.
- Production Monitoring: Compare real-time equipment parameters against the process window model. Any parameter drift into the yellow zone triggers an immediate alert.
- Continuous Updates: Accumulate production data to continuously refine the window model.
- Cross-Tool Expansion: Extend the window validated on one tool to other tools through Chamber Matching techniques.
This closed loop is the core philosophy of MST Semiconductor’s NeuroBox product family — making AI truly serve the daily work of process engineers.
Let AI Help You Find the Process Sweet Spot
NeuroBox E5200 uses Smart DOE and response surface modeling to help you locate the optimal process window with the fewest test wafers, reducing test wafer consumption by 80%.

